Response Spectrum Analysis
Response spectrum analysis (RSA) is a linear analysis method, which converts a problem in dynamics into an equivalent problem in statics. It considers the contribution from each natural mode of vibrations of structure, and calculates the likely maximum elastic seismic response of the structure. RSA provides insight into the dynamic behavior by measuring acceleration, velocity, or displacement as a function of structural period for a given time history and level of damping. It is practical to envelope response spectra such that a smooth curve represents the peak response for each realization of structural period.
LEAP Bridge Concrete (LBC) adopted the solution of response spectrum analysis from Bentley STAAD.Pro, offering multimode RSA in seismic analysis and design to all LBC users. Basic information on the response spectrum analysis is provided below. Users may refer to the Technical References of STAAD.Pro for more technical details.
In particular, two major aspects are needed to use STAAD solution for response spectrum analysis. The first one is mass modeling of the bridge model, and the other is generation of the appropriate design response spectrum.
All masses that are capable of moving should be modeled as loads applied in all possible directions of movement. Even if the loading is known to be only in one direction there is usually mass motion in other directions at some or all joints and these mass directions (applied as loads, in weight units) must be entered to be correct. Joint moments that are entered will be considered to be weight moment of inertias.
The natural frequencies and mode shapes of a structure are the primary parameters that affect the response of a structure under dynamic loading. The free vibration problem is solved to extract these values. Since no external forcing function is involved, the natural frequencies and mode shapes are direct functions of the stiffness and mass distribution in the structure. Results of the frequency and mode shape calculations may vary significantly depending upon the mass modeling. This variation, in turn, affects the response spectrum and forced vibration analysis results.
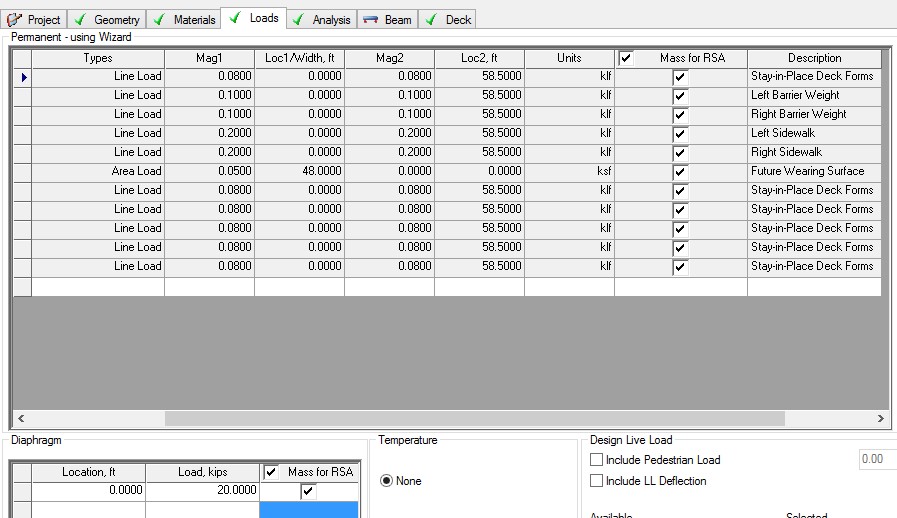
In LEAP Bridge Concrete, when a full bridge model is created, the corresponding grillage model will be generated internally according to the guideline provided by the final report of National Cooperative Highway Research Program (NCHRP) Project No. 12-71 (2008). A mass table of the grillage model will be automatically generated. By default, all the mass due to the defined components from superstructure and substructure are included in the mass table. However, users also have flexibility to adjust the mass modeling table by entering LBC superstructure modules and check/uncheck the Mass option box for the dead loads defined by the structure components, as shown in the screenshots below.
Another key to the response spectrum analysis is to construct an appropriate response spectrum for a particular soil profile. A response spectrum can be defined as a graphical representation of the maximum response of single-degree-of-freedom elastic system to earthquake ground motions versus the periods or frequencies of the system. The response spectrum is actually a summary of a whole series of time-history analysis.
In particular, the response spectrum analysis based on the STAAD solution allows the user to analyze the structure for seismic loading. For any supplied response spectrum, joint displacements, member forces, and support reactions are calculated for each mode used in the spectrum solution. The individual modal responses are combined using one of the square root of the sum of squares (SRSS), the complete quadratic combination (CQC), the Ten Percent (TEN) or the absolute (ABS) methods to obtain the resultant responses. Results of the response spectrum analysis may be combined with other results of the static analysis to perform subsequent design. To account for reversibility of seismic activity, load combinations can be created to include either the positive or negative contribution of seismic results.
RSA Seismic Parameters dialog is shown in the screenshot below. Brief explanations about the terms used in the dialog are provided as well.

- Code
Specify the design code to generate design response spectrum. The option of Custom allows users to manually input the data of the design response spectrum under the table of Special Data and Curve.
- Combination Method
Combine the responses from each mode into a total response.
| Setting | Description |
|---|---|
| SRSS | Square Root of Summation of Squares method. |
| ABS | Absolute sum. This method is very conservative and represents the worst case combination. |
| CQC | Complete Quadratic Combination method. This method is recommended for closely spaced modes instead of SRSS. |
| TEN | Ten Percent Method of combining closely spaced modes. NRC Reg. Guide 1.92 (Rev. 1.2.2, 1976). |
| CSM | Closely Spaced Method as per IS:1893 (Part 1)-2002 procedures. |
| GRP | Closely Spaced Modes Grouping Method. NRC Reg. Guide 1.92 (Rev. 1.2.1, 1976). |
-
Site location and ground motion coefficients
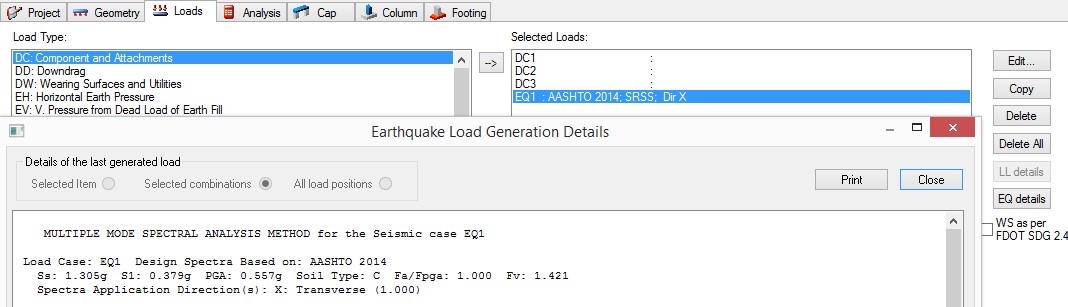
When AASHTO option is selected, it allows to specify the site zip code, the corresponding ground acceleration coefficients (PGA, Ss, and S1) will be derived from the national ground motion database.
-
Spectrum Table
Long Period (TL): to specify the range of the Period in the design response spectrum
Site Class: a site shall be classified as A through F according to the site class definition per LRFD Art. 3.10.3.1.
For AASHTO code option, the site factors (Fpga, Fa, and Fv) are automatically calculated based on the site class and the ground acceleration coefficients. Users can also manually change those site factors too. In any case, if you want the auto calculated site factors back, input zero value and click other input field, then the zero value will be automatically replaced by the auto calculated value.
- Application Direction and
Factor
Specify the global direction(s), in which the design response spectrum is to be applied. The response spectrum may be applied in one, or more directions simultaneously. Directions not applied will use zero in the related factors.
Two methods to produce response spectrum results are offered. The Dominant and Sign options may be used in the input file to produce signed output. STAAD solver can assign a mathematical sign (positive or negative) to the modal results by one of two means. The Dominant and Sign options may be used in the input file to produce signed output. If more than one direction is applied, the mode shape number is needed in order to use the sign. If only one direction is used and mode number is zero, STAAD solver will automatically find the mode shape for which the mass participation is the highest and use the sign from that mode
- Missing mass
Use Missing Mass method to include the static effect of the masses not represented in the modes. The spectral acceleration (length/sec2) for this missing mass mode is the value entered in length per second squared units (this value is not multiplied by SCALE). If the Missing Mass is zero or not entered, then the spectral acceleration at 33Hz (Zero period acceleration, ZPA) is used. The results of this calculation are SRSSed with the modal combination results. If either Missing Mass or ZPA is not entered, the defaults will be used. Missing mass does not include the effect of masses lumped at the supports unless the support is a stiff spring or an enforced support.
- Structural Damping
This is to be used for specifying the damping ratio which will be applied to all modes. The default value is 0.05.
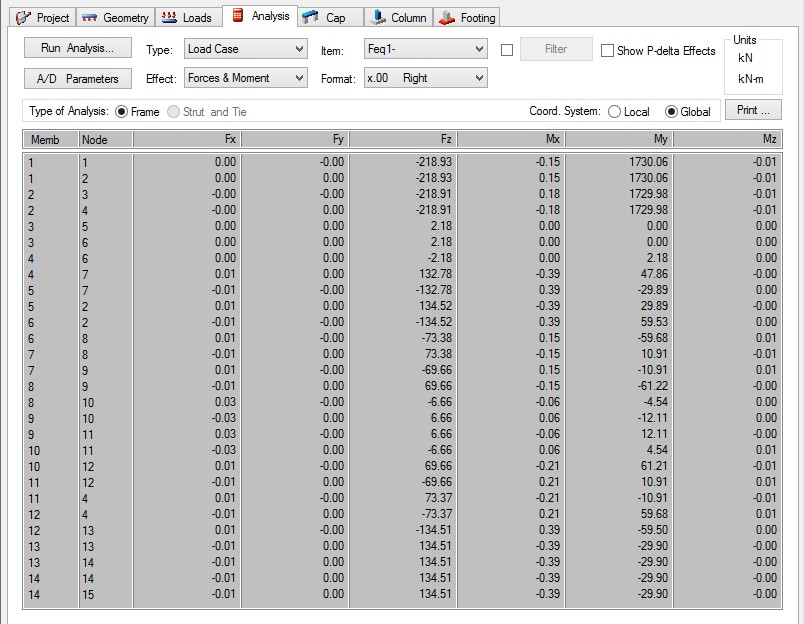
The generated design response spectrum together with the mass table will be internally sent to STAAD solver for the response spectrum analysis. The results are then mapped back to LBC, and combined with other load effects for the further design of the substructure. Typical response spectrum analysis results of the substructure can be found under the Analysis tab, as shown in the screenshot below.
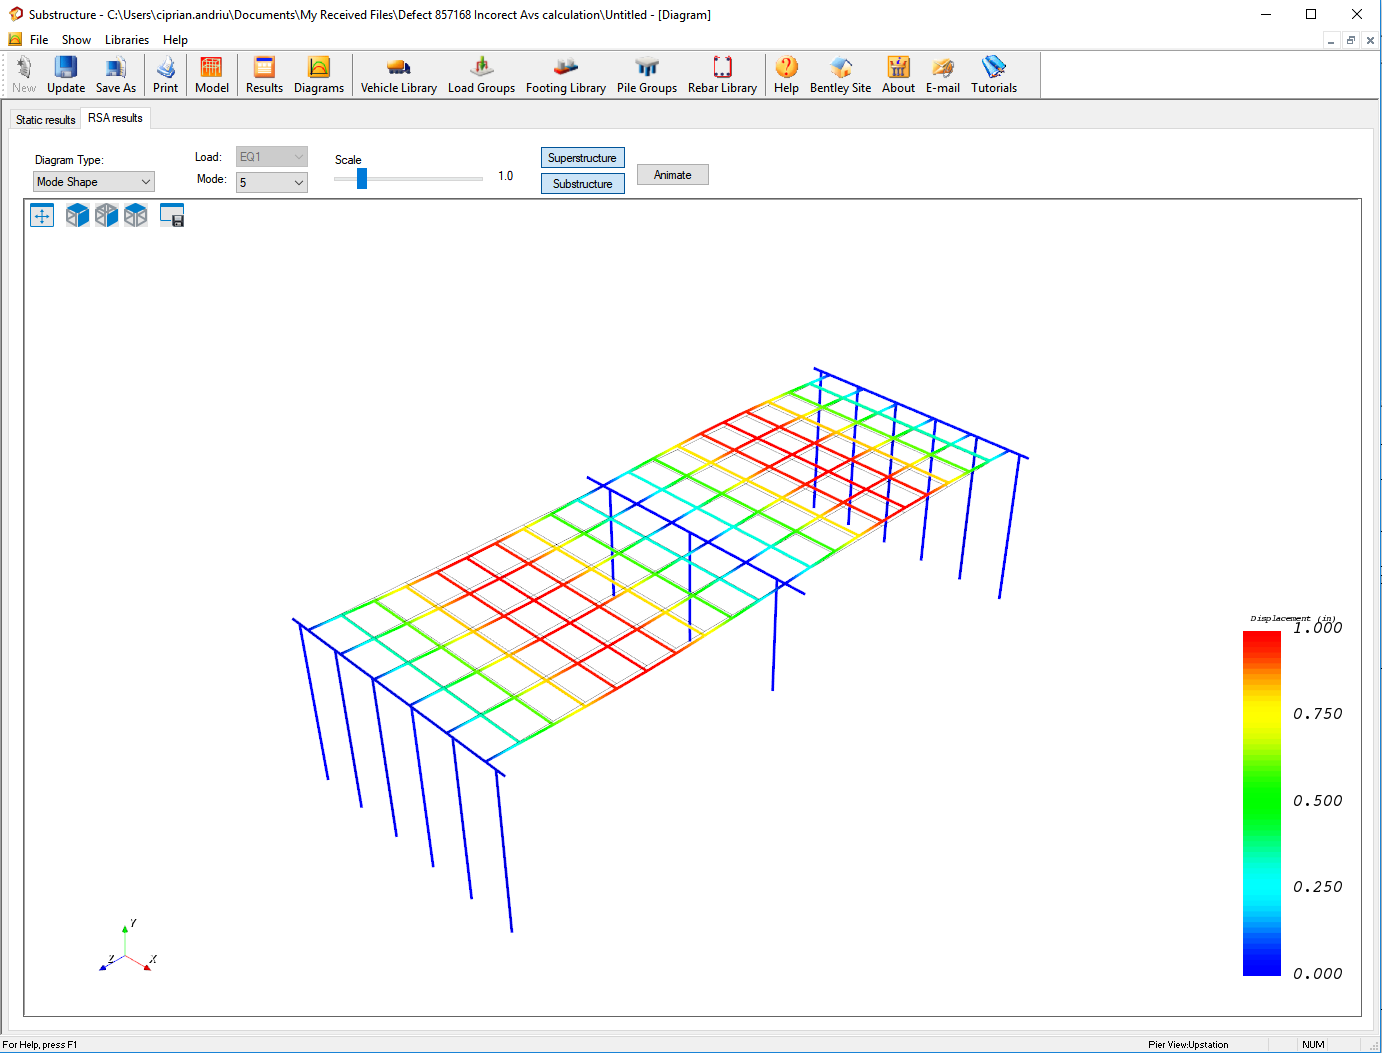
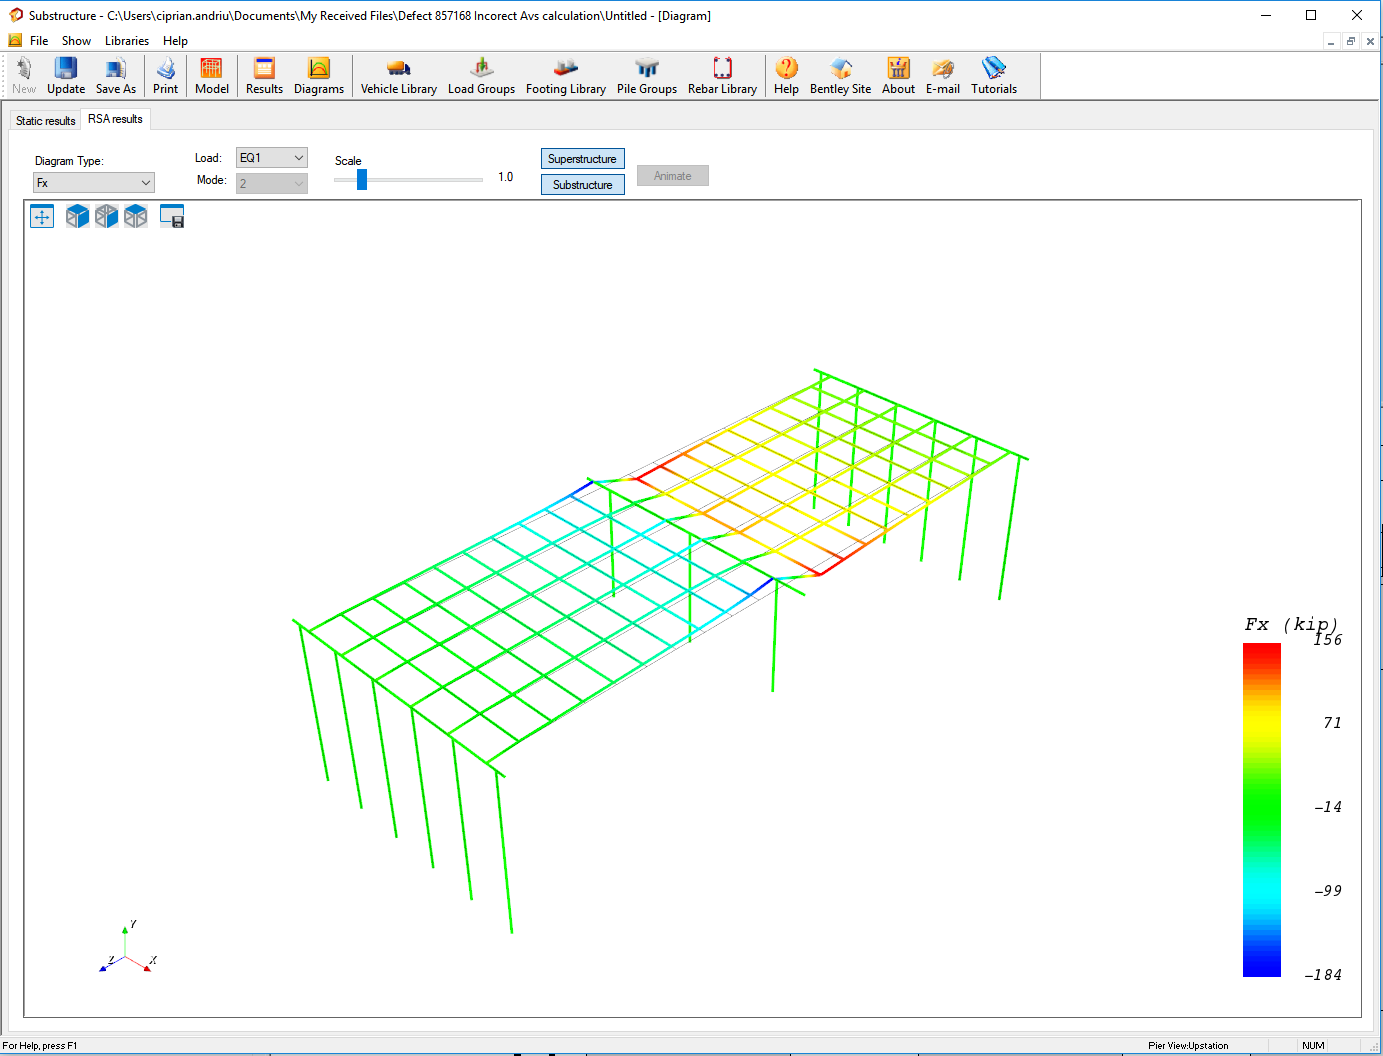
The response spectrum analysis results in graphic format for the mode shape, force, moment, and displacement of the bridge can be accessed thru Show menu -> Diagrams -> RSA results tab. Following pictures show two different mode shapes and lateral forces.